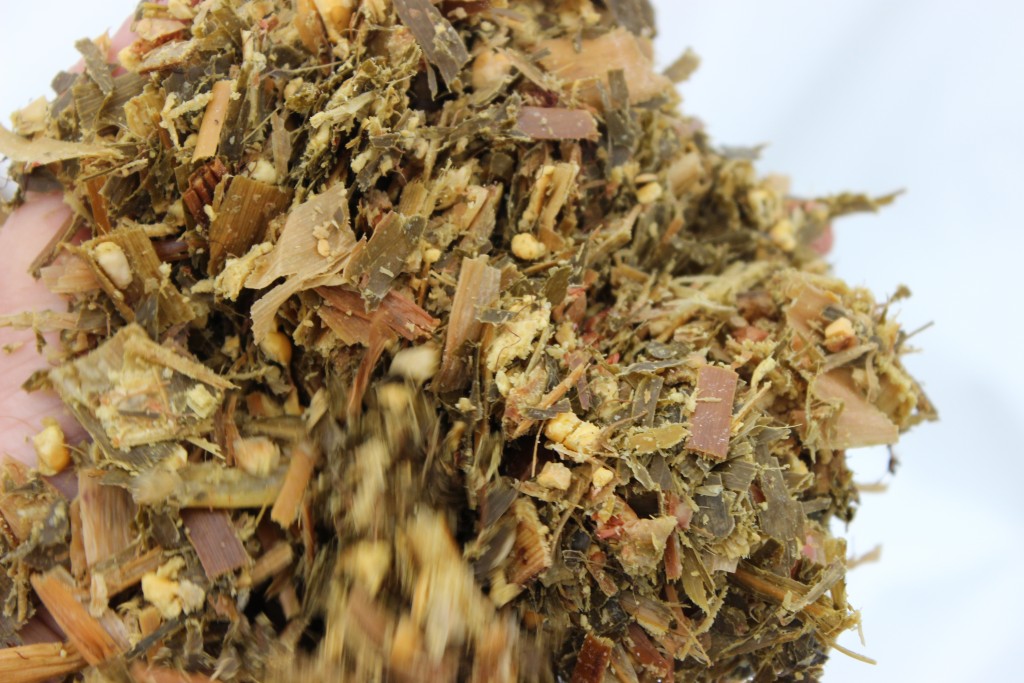
 If the fiber digestibility portion of a forage analysis were a visual display, NDFd-30 hour (or 24, or 48) would be a photo snapshot, framing available details at a moment in time, while TTNDFD would be more like a slideshow or even a short video clip. TTNDFD adds another dimension to our understanding of how fiber moves through the animal.
Fiber Digestibility & TTNDFD
Digestible fiber has become a new emphasis of dairy nutrition in recent years as a way to measure the total energy the cow can get from a given feed source. TTNDFD, or total tract NDF digestibility, is one of the most innovative and cutting edge tools available to get a complete picture of fiber digestibility and how feeding one forage versus another will impact the cow’s productivity, and overall how well that forage will be utilized. It provides more detailed and more accurate information about fiber digestibility than you would get from a 30 hr and 48 hr NDFd analysis.
Rock River Labs in Watertown, WI is currently the only lab offering this service, and was a pioneer in making it commercially available. Developed by Dave Combs, a dairy scientist at the University of Wisconsin, TTNDFD is used to predict how the cow will use the fiber in the forage based on three main parameters:
- How much of the fiber is digestible
- How fast the fiber digests
- How long that cow holds the fiber in her digestive system
Fiber Digestibility Results
Results can give us a pretty good understanding of how much of the fiber will be digested within the cow. As Rock River Lab puts it, “TTNDFD uses standardized and dynamic in vitro rumen digestion data, as well as precisely measures the height and shape of the rumen NDF digestion curve for TTNDFD.”
The TTNDFD calculation uses potentially digestible NDF values (pdNDF), Kd and Kp rates, standardized NDFd (24, 30, and 48 hr), and indigestible NDF (iNDF). It uses NDFd data as one component in the calculation, but single time NDFd values are poorly correlated to total tract fiber digestibility, with total tract numbers providing far greater accuracy.
TTNDFD is generally used in two different scenarios:
- To predict the rate of NDF digestion in rumen fluid, which illustrates the forage quality.
- To predict milk production when forages are part of the ration of dairy cows, giving us a good understanding of how milk production will change with changes in NDF or NDFd of the forage. A 2-3 unit change in fiber digestibility as given by TTNDFD has been found to correspond to a one pound change in milk production.
The results give us a digestibility coefficient that can be used in ration-balancing programs that calculate the energy value of the forage. Using TTNDFD can help us do a better job figuring out which feed to use for high-producing animals.
TTNDFD also provides a more standardized way to evaluate and compare the digestibility of all forages. NDFd30 and 48 have no standard procedure from lab to lab, and can’t be used to reliably compare fiber digestibility across different species or types of forage.
Additionally, the use of single time point values does not differentiate between indigestible and undigested potentially digestible fiber. Showing the progression of digestion over time lets us evaluate the cow’s true overall ability to digest and utilize ALL the energy from the forage.
How much milk your forage makes ultimately depends on both the total amount of potentially digestible fiber available in the forage AND the rate of fiber digestion.
Interpreting Lab Results
The curve shown by the lab analysis gives us a visual timeline of the fiber digestibility over the entire course of the digestion process, with time on the x axis and NDF digestibility on the y axis. Often the curve of forages with lower fiber digestibility levels off, while those of very high quality continue at a similar or even steeper slope later in the digestion process.
This graph of TTNDFD for the forage often appears along with two other, fainter lines – one for 85th percentile of all forage samples; one for 15th percentile of all forages. This gives an easy visual of the sample relative to other forages, and gives a benchmark to help you understand if your numbers are high, low or average. For TTNDFD and many other quality numbers, this depends heavily on maturity stage at harvest. If you harvested pre-heading or pre-bud, your TTNDFD and other quality values will likely be above average, as the forage is around optimal quality at that maturity.
What values should you look for? Forages with a TTNDFD greater than 48% should go to high-producing cows and fresh cows, while those with lower values are best fed to late lactation cows, dry cows, and heifers. (The percentage you see expressed is TTNDFD as a percentage of total NDF.)
Generally, the benchmark for forages should be 46-48%; anything greater than this can be considered superior quality.
Using TTNDFD
These are a few scenarios where TTNDFD comes in handy for you or the nutritionist formulating your ration –
- You are anticipating changes in quality of forages based on known harvest differences.
- You are changing a feed type or variety.
- You are troubleshooting a ration where management factors are not limiting production.
- You are evaluating forage inventories.
Speak to an expert at King’s AgriSeeds now at 1-717-687-6224 or email us at [email protected].
